Online atlas maps health risks
- 29 April 2014
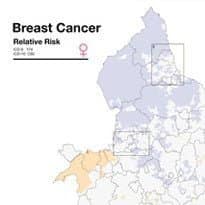
Researchers have created an interactive online atlas of England and Wales allowing the public to view the geographical risk for a range of health conditions.
The Environment and Health Atlas uses census ward data from 1985 to 2009 to display the geographical variation for health conditions including nine different cancers, heart disease and kidney disease.
The atlas has been produced by the Small Area Health Statistics Unit, part of the Medical Research Council and Public Health England’s Centre for Environment and Health.
It also includes maps for a range of environmental factors such as exposure to sunshine, air pollution and agricultural pesticides.
Commenting on the launch of the atlas, Paul Pharoah, professor of cancer epidemiology at the University of Cambridge, said:
“The atlas comes across as a data ‘tour de force’ and is a tremendous achievement in describing in detail the geographical distribution of a wide range of environmental exposures and health outcomes.”
However, Pharoah said it is “inappropriate” to draw any causal links between environmental factors and health conditions. He added that that people cannot use the atlas to determine their individual risk for the various diseases and conditions.
The unit regularly collects health and population data at a small area scale to assess health risks from environmental factors, and holds comprehensive computerised sets of health and demographic data.
The researchers said the map is different from similar projects due to its use of census ward data with an average population of 6000 for each ward, allowing a closer look than other atlases which use “coarser” data at a district, NHS board or primary care trust level.
Statistical “smoothing” was used to reduce the effects of random variation for rare diseases in small areas, while the atlas also adjusted for age and deprivation levels which had an impact on disease rates.
The researchers said the maps cannot answer why geographical patterns exist, but can be used to “help identify important questions for further research and potential policy interventions”.
The mortality, births and population data is from the Office for National Statistics using the national mortality and birth registrations as well as the census.
The cancer data comes from the national cancer registries in England and Wales, while the underlying data for the environmental maps is from a range of agencies such as the UK Meteorological Office and the National Environment Research Council.
David Coggon, professor of occupational and environmental medicine at the University of Southampton, said the sources of data are the most reliable available but do have some limitations, such as an inadequate consideration of lifestyle factors.
“These unavoidable shortcomings do not invalidate the analyses presented, but they are a reason for caution in interpretation,” he said.
“Even where geographical differences are not due simply to chance, they will not necessarily reflect a hazard in the environment.”