Dashboarding through the snow
- 30 December 2015
Tens of thousands of A&E patients are facing long delays for treatment this winter, says the London Evening Standard. Twelve NHS trusts are so full that they don’t have a single bed to spare, says the Daily Telegraph.
Those headlines come from the middle of December – a few weeks before the traditional “winter pressures” season really kicks in for the NHS. One trust that seems to be better placed to cope than most is Wrightington, Wigan and Leigh NHS Foundation Trust.
It was the fourth best performing trust for A&E waiting times in the first quarter of 2015, coming in behind two specialist children’s hospitals and Luton and Dunstable University Hospitals NHS Trust. And it has been performing well this year, seeing 95% of A&E patients within four hours in October and 96.8% in September.
Chief executive Andrew Foster explains that this is a remarkable change from 2010, when the trust failed to meet its A&E target for three quarters of the year and was rated ‘red’ by Monitor.
Foster says the turnaround is down to a number of factors, including good partnership working across the local healthcare system. But one tool that does stand out as a catalyst for change is the trust’s in-house A&E dashboard, which gives staff a clear, real-time overview of A&E, and managers a way to predict when services will be under extra pressure.
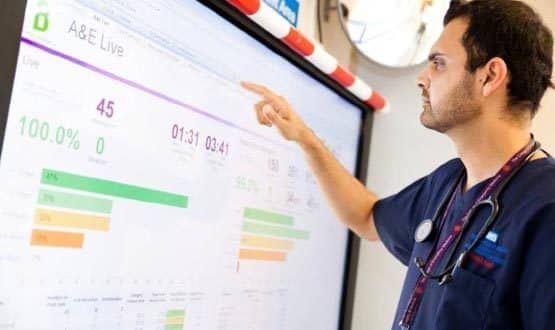
Planning ahead
The high regard in which Foster holds the dashboard is obvious; walk into his office and it’s there on a big screen providing lines of immediate information on A&E, including how many people are in waiting to be seen, how many breaches of the four-hour wait time there have been, and how close people are to breaching that wait time.
“Until we started using the dashboard, this information came the next day, retrospectively. There was no forward look at all, there was no live data,” says Foster. “Since this has come along – it could be coincidence – but we’ve been performing better and better. But I don’t think it is coincidence.”
Mark Singleton, head of business intelligence at Wrightington, Wigan and Leigh, says the main way the dashboard has benefited the trust has been the way it uses data to make accurate predictions about how busy A&E will be certain days.
This enables the trust to undertake better workforce planning; and is a big improvement on its previous reliance on calling in agency staff to cover peak periods. “Now they can plan their rotas weeks in advance, and not have to rely on last minute agency bookings,” Singleton says.
Dr Stephen Gulliford, a consultant at the trust, said the tool is “scarily accurate” when it comes to predicting how busy A&E is going to be.
“It enables us to get the right mix of staff in the right area,” he says. “It is just changing the way people work. The clinicians have been very positive and it’s become a great tool for engagement.”
The level of detail the tool goes into allows the trust to make very specific changes, says Singleton. As an example, he mentions that after analysing the time patients at which patients came into A&E, consultants moved their shifts patterns back by two hours.
A culture of immediacy
In addition to supporting practical changes, the tool is helping to change staff culture. Foster says the A&E department has embraced “immediacy” when it comes to dealing with any problems that are building up.
It’s easy to see how; there are large touchscreens showing the dashboard on the walls of A&E corridors and staff members regularly access the tool on computers and tablets. No clinician is far away from knowing exactly what is going on in A&E.
The touchscreens also act as a meeting point for regular ‘comm cell’ discussions, at which senior staff from a variety of areas, including nurses, paramedics and consultants, gather round to go through what’s been in happening and to be informed of any updates to the dashboard from one of the business intelligence team.
At the comm cell Digital Health News observed at the Royal Albert Edward Infirmary, the group discussed a surge in younger people attending A&E the previous week, suggesting that one of the reasons may have been changes to the local NHS 111 service.
Staff also welcomed new dashboard functionality to divide A&E attendances by male and female and children; development of the tool is clearly an ongoing process.
In-house innovation
Clinicians have been involved in the design and the use of the dashboard since development began around 18 months ago, explains Ian Bullen, senior intelligence analyst at Wrightington, Wigan and Leigh.
It is one of several products developed by an in-house development team whose goal is to take existing, raw data from the trust’s various systems and to turn it into something clear, understandable and usable for staff, mainly using the QlikView platform.
Describing the ‘X Factor journey’ of the software, Bullen says that the idea stemmed from a period in summer 2014 when the trust experienced a couple of days when A&E attendances soured to more than 330, compared to an average of around 240.
Aware that things would only get worse over winter, the business intelligence team began work on understanding how they could use data on previous A&E performance to improve future performance.
The first phase of the project involved sticking paper charts on A&E corridors and working with frontline staff on identifying the kind of data they found useful. The next stage was to make this data live and available on an app, working closely with clinicians to make sure the design was suitable and all the key data was there.
To understand what kind of demand was coming through the doors of A&E, the trust looked at the tariff for each patient; assuming that more expensive payments would be for sicker patients.
Bullen says: “We implemented predictive methodology to try work out what we could expect to see through the doors in the following weeks. On the back of those horrible days we had in June and July last year, we wanted to know: could we get to stage where we knew when those days were coming?”
Spreading good practice
The dashboard is also having an economic impact – for the first quarter of this year, the trust’s penalties for A&E breaches were down by £127,000. “It’s already paid for itself in terms of the penalties we’ve saved,” says Bullen.
The next goal for Singleton and his team is to share what they’re doing with the wider NHS. Several NHS organisations are interested in implementing the dashboard, which a number of award wins and nominations have helped to promote.
Wrightington, Wigan and Leigh doesn’t have the skills and resources to market and deploy the tool by itself though, so has teamed up with NHS Shared Business Services to handle the integration and implementation side of things.
Singleton says this has meant his team has had to change its mindset to one that doesn’t just develop tools for Wrightington, Wigan and Leigh but for any hospital, including those that might have multiple A&E sites or use a different terminology.
The way the tool has been designed also means that it can be used with any clinical system that reports A&E information; they just need access to the raw data that any trust should have.
Singleton is clearly confident that the success of the dashboard at Wrightington, Wigan and Leigh can translate to other organisations, although the trust won’t be selling a complete fix for broken A&Es. This is a supportive tool, and one that continues to be developed to be helpful in the right ways.
“Last week’s A&E performance wasn’t good,” says Singleton. “We were in red last week. It’s all around how we use that intelligence and how we start that discussion with the service and how do we learn from that and how do we improve.”